
High Parameter Flow Cytometry
Our work relies heavily on 30-parameter flow cytometry, first introduced by Pratip Chattopadhyay in 2014.
Pratip co-led the development of the technology (with Stephen P. Perfetto, NIH), as part of a co-operative research and development agreement between his mentor (Mario Roederer, NIH) and BD Biosciences.

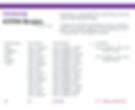
Here's an example of our application of this technology, pulled from a study of patients with a hematologic malignancy (a "blood cancer").
We can identify cell types before treatment (panel B) that are higher or lower in patients destined to respond to therapy.
In panel D, we describe these cells precisely and comprehensively. This kind of analysis will one day help patients and physicians smartly choose the therapies best suited for their individual disease.
We have built a suite of high parameter flow cytometry antibody panels (eight are in routine use), unique quality control tools, and informatics that lead the field and are now coalesced into a robust pipeline. We have tested over 1500 samples in our first 1.5 years in operation, including tissue from brain, lung, pancreas, and gut alongside bone marrow and peripheral blood samples.
Molecular Cytometry

Molecular Cytometry technologies replace fluorescent tags on antibodies with oligonucleotides. Cell staining is just like flow cytometry, but once stained, single cells from the sample are captured in droplets or microwells. Cells are lysed, and two fractions are analyzed - the first contains all the oligonucleotide tags from bound antibodies, while the second contain mRNA from expressed genes.
There are a few versions of this technology available, including CITE-seq (for which we did the benchmarking against flow cytometry), REAP-seq, and BD Biosciences AbSeq.

Example staining from a molecular cytometry experiment we performed with BD AbSeq technology. Note the clear identification of regulatory CD4+ T-cells, and the additional insight that there are CD95+CD39+, CD95+CD39-, and CD95-CD39- subsets of regulatory T-cells. We can reveal similar heterogeneity in exhausted (PD1+/CD279+) cells amongst CD8+ T-cells.
Combinatorics
High parameter data analysis presents a new challenge. The content from experiments often strips our ability to visualize or interpret it. The field copes with this by relying on dimension reduction, essentially identifying the parameters that differ most across patient groups, or by attempting to group cells by shared expression in some dimensions.
We took a hard look at this approach, asking a number of questions: 1) How do you choose and trust the various algorithms that are out there? 2) How do algorithms report their performance, reproducibility, and that dimension reduction hasn't reduced out too much information? 3) How do you report patient-to-patient variation, and statistically compare patient groups? 4) How do you assess the complete phenotype of potentially interesting cells that have been dimension-reduced? The quick answer is that these issues are difficult - if not impossible - to resolve with the approaches currently used.
And our biggest concern was philosophical - why work so hard to measure so many cellular traits, only to drop them from our visualization and analysis?!?!
So we turned the problem on its head. We employed combinatorics to precisely identify all the cellular phenotypes in a sample, with the aim of completely and comprehensively analyzing the data.
This approach - identifying and counting all possible marker combinations is not new. The general term is "combinatorics." We apply combinatorics to precisely identify the cells important in an immune response, and with our approach can clearly report the phenotype of cells important in an immune response or related to survival. We can identify cell types defined by simple sets of markers